Distributed Systems
Finsec — Real-Time Trading System
Finsec is designed to reduce the time discretionary traders spend watching charts without flattening their strategy into a generic signal. A trader can mark the structure and execution logic of a setup directly on a chart, save it as reusable strategy snapshots, and search historical data for formations that behave like the original idea.
Those candidates are evaluated through both structural similarity and the meaning of the trader's annotations—candle groups, zones, levels, entries, exits and risk marks. The trader can accept or adjust historical examples, replay the strategy in a backtest, and apply the learned formation back to a current chart as it forms.
Finsec separates the workloads that fail differently: live market distribution, authenticated trade execution, and historical retrieval. A slow provider fetch, large chart history, or burst of orders does not sit directly in every user's request path.
Python produces and stores market data, Redis carries hot state between services, Go owns WebSocket fanout and execution, PostgreSQL stores transactional records, and Parquet holds long-range candle history. The product intelligence and the measured real-time paths are two halves of the same system: one encodes the trader's edge and the other keeps the market and execution loop responsive under load.
Key Features
Chart-native strategy capture
Turns a trader's reference setup into reusable candle, zone, level and execution annotations rather than separating the strategy from the chart where it was identified.
Historical structural and semantic matching
Searches earlier market windows for comparable formations, then validates both their price structure and the annotated relationships that make the setup meaningful.
Live formation projection
Evaluates a developing chart against saved strategy snapshots and projects mapped structure, entry, exit and risk marks as the formation progresses.
Strategy-aware backtesting
Replays historical candles through the same forward strategy logic, position lifecycle and performance analysis used to reason about a current setup.
Live market data and chart history
Clients receive an immediate cached chart, live candle updates, and older 500-candle pages over the same WebSocket connection.
Authenticated trade execution
Long-lived trade sockets support market and limit orders while retaining the user's execution context between messages.
Complete position lifecycle
Positions can be opened, updated, batch-closed and reflected in account-level balance, P&L and performance statistics.
Measured system behaviour
Separate K6 scenarios exercise market-data fanout across 10,000 clients and the authenticated execution path at increasing write rates.
Implementation
Structured strategy snapshots
A saved strategy keeps one or more annotated candle examples, including structural regions and execution roles, so the engine can compare evidence across several expressions of the same idea.
Similarity and semantic validation
Candle windows are normalised for structural comparison, aligned across different lengths and then checked against annotation-specific interactions such as touches, crosses, closes and rejections.
Forward formation engine
A growing live or replayed window is evaluated against strategy references, producing formation progress, confidence, consensus and projected chart annotations.
Backtest session engine
Historical candle sessions share the forward strategy path, persist their cursor and positions, and produce trading, drawdown and equity analysis as the market is replayed.
Go service layer
Owns the long-lived WebSocket connections, bounded fanout workers, session-scoped trade handling, and delivery of execution confirmations.
Python data engine
Produces or retrieves market candles, maintains the data pipeline, and prepares historical chart pages for retrieval.
Storage boundary
Redis carries hot state and pending work, PostgreSQL owns transactional records, and Parquet holds long-range candle history.
Architecture in motion
How it works
Chart observation to reusable strategy
The trader selects a reference formation and annotates what makes it meaningful instead of reducing the setup to a screenshot or paragraph. Candle groups, zones, levels and markers record both market structure and execution intent, then multiple examples can be kept as snapshots of the same strategy.
- Reference chart
- Candle window
- Structural annotations
- Execution annotations
- Strategy snapshots
Annotations encode structure, entry, exit, stop-loss and take-profit roles across candle groups, zones, levels and markers.
Historical matching and trader validation
Saved snapshots are normalised and compared with earlier market windows. Structural scoring finds similar price movement, while semantic checks ask whether the annotated relationships—touches, crosses, closes and rejections—also hold. Candidates remain visible for the trader to accept, reject or adjust.
- Saved snapshots
- Historical windows
- Structural scoring
- Semantic checks
- Accepted candidate
Candidate ranking combines structural and semantic evidence; required annotations act as qualification gates rather than cosmetic overlays.
Validated strategy back onto the market
Accepted historical candidates become additional strategy snapshots. A forward pass evaluates each growing candle window against those references, tracks formation progress and confidence, and projects the mapped entry, exit and risk annotations onto the current chart.
- New candles
- Forward formation scan
- Reference consensus
- Projected annotations
- Live chart state
Developing setups move through forming, confirmed or invalidated states while their mapped annotations remain visible on the chart.
Strategy-aware backtesting
Historical candles are replayed through the same forward strategy path used for a developing market. The session advances candle by candle, applies the active strategy, manages positions and records the resulting trading and equity behaviour.
- Historical session
- Candle replay
- Strategy forward pass
- Position lifecycle
- Equity analysis
Backtest analysis reports realised and unrealised P&L, return, win rate, best and worst trades, maximum drawdown and an equity curve.
Market-data delivery
One producer creates each ticker update, Redis publishes it once, and Go fans the same payload out through bounded worker groups. Adding clients expands delivery work without multiplying provider calls or rebuilding the candle for every connection.
- Provider / simulator
- Python broadcaster
- Redis Pub/Sub
- Go worker pool
- WebSocket clients
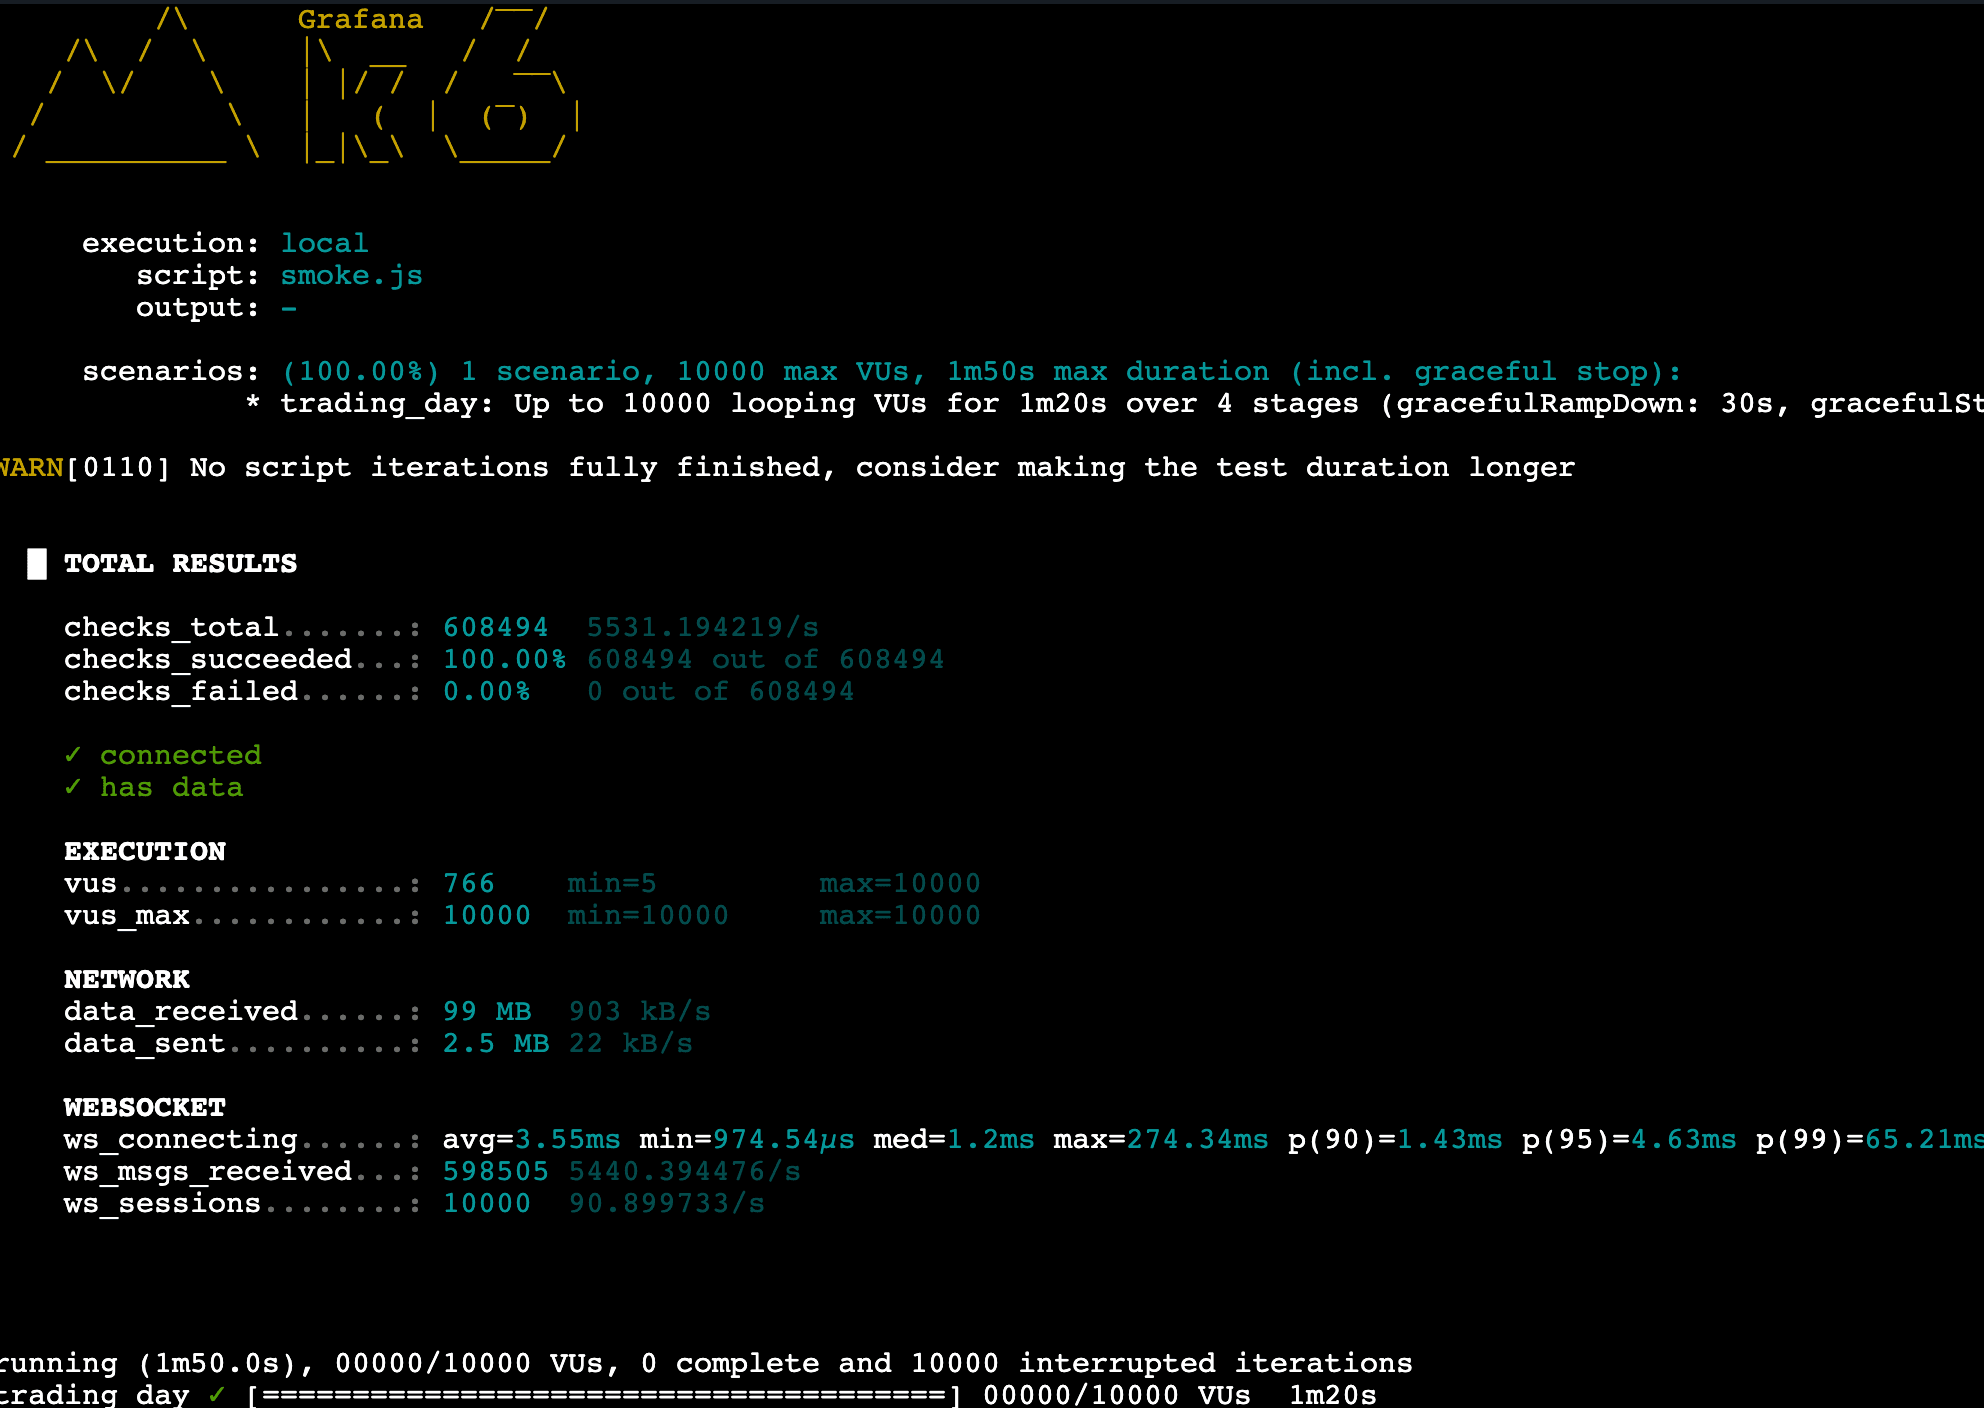
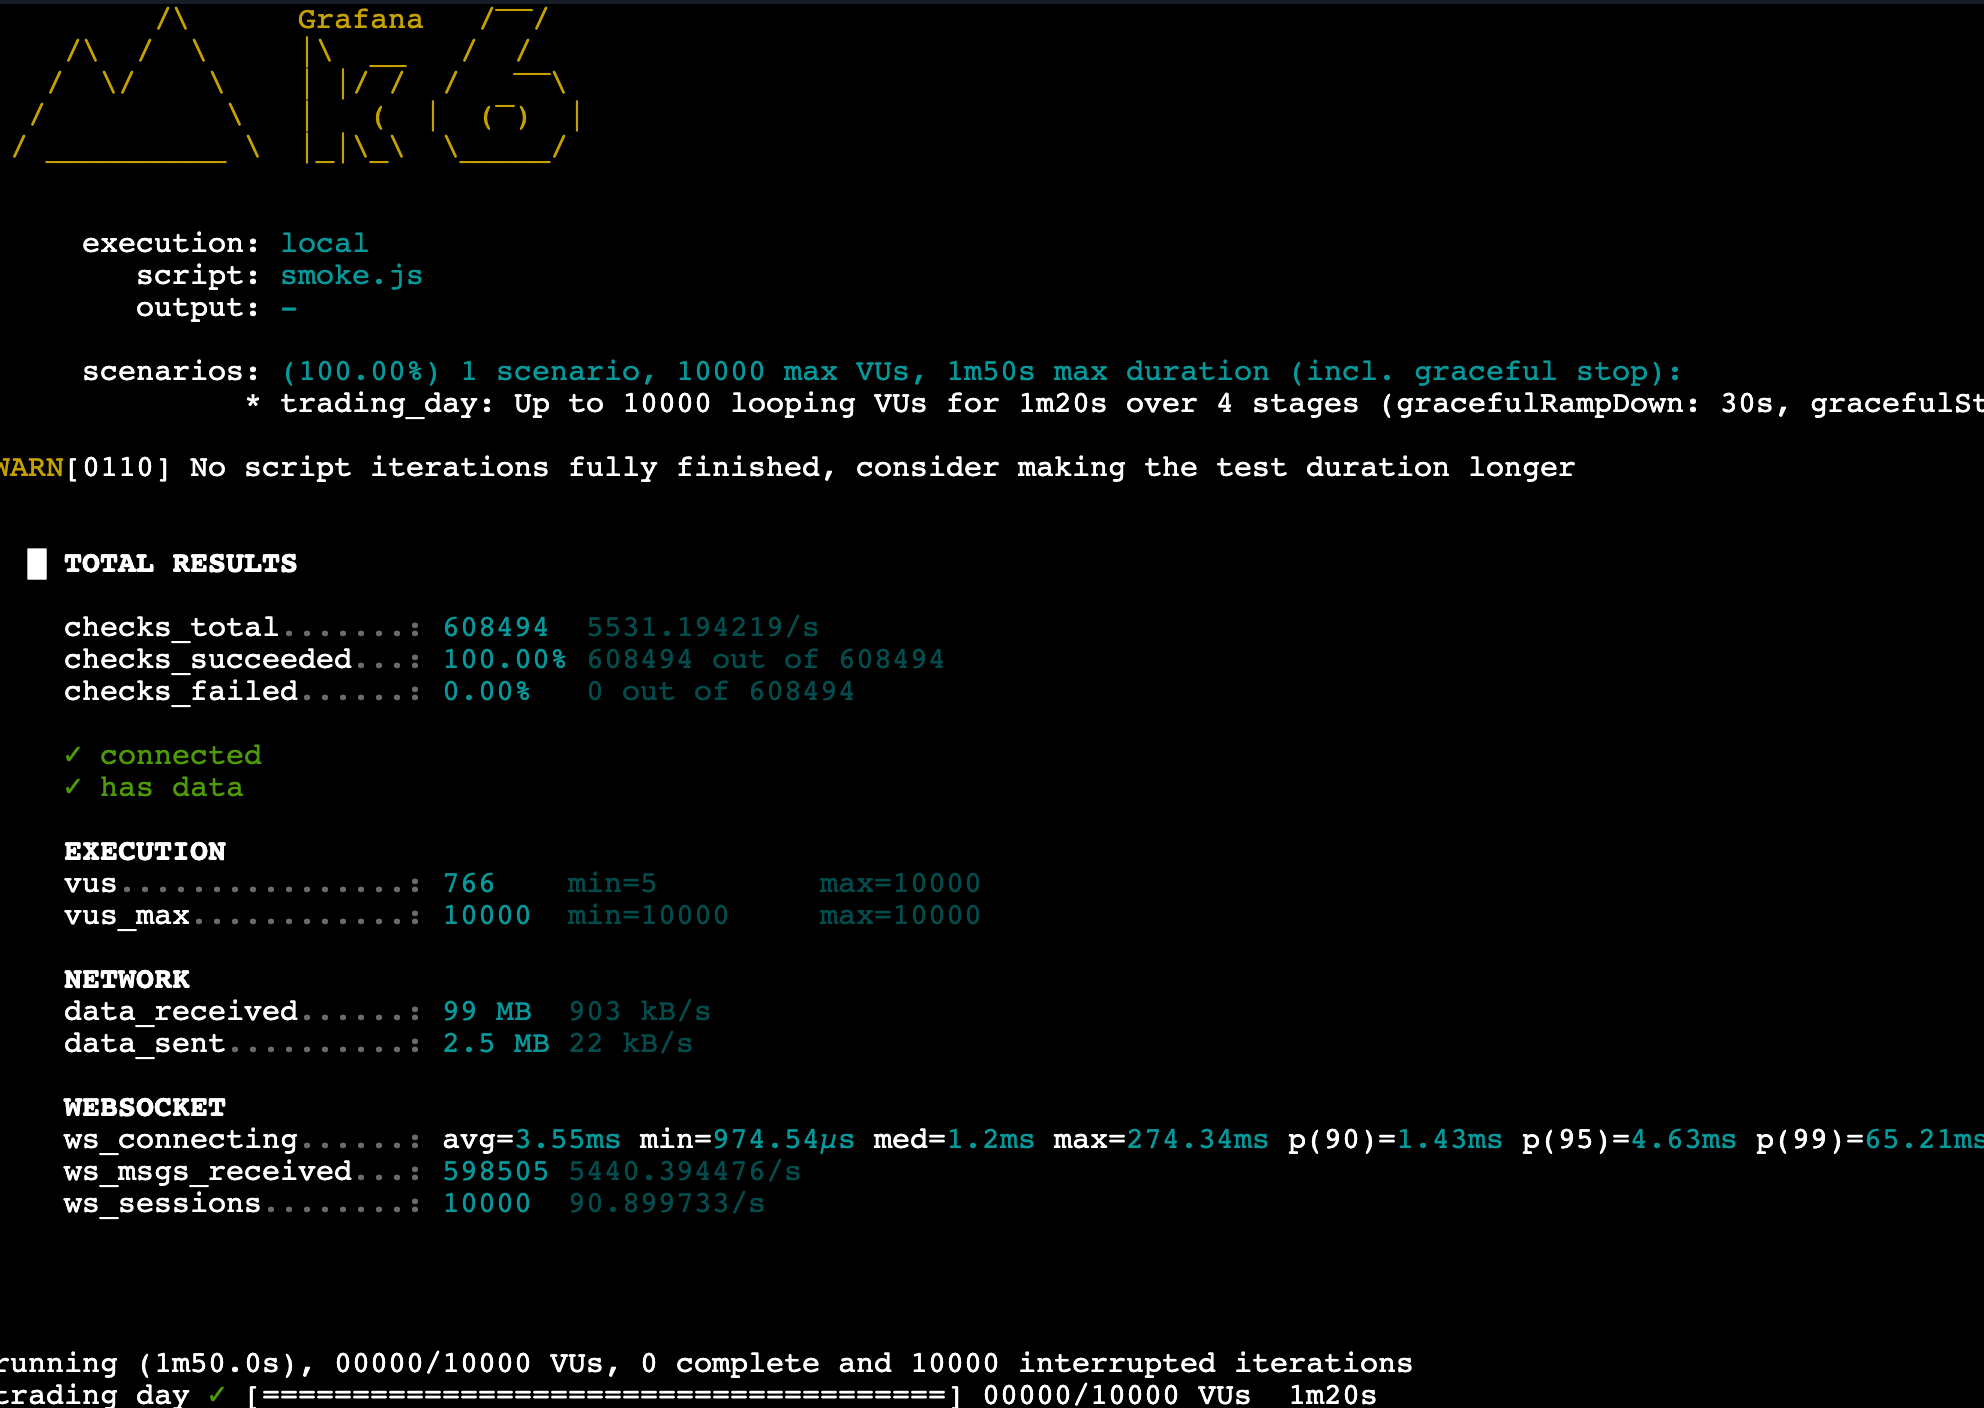
10,000 concurrent clients · 598,505 messages delivered · 65.21ms p99 WebSocket connection time
 Open full size ↗
Trade execution
The user is authenticated and their account is loaded when the socket opens. That context stays with the connection, so each trade can move directly into the Redis pending queue, a batched PostgreSQL write, and a confirmation routed back to the originating client.
- JWT handshake
- Account context
- WebSocket order
- Redis queue
- PostgreSQL batch
- Targeted confirmation
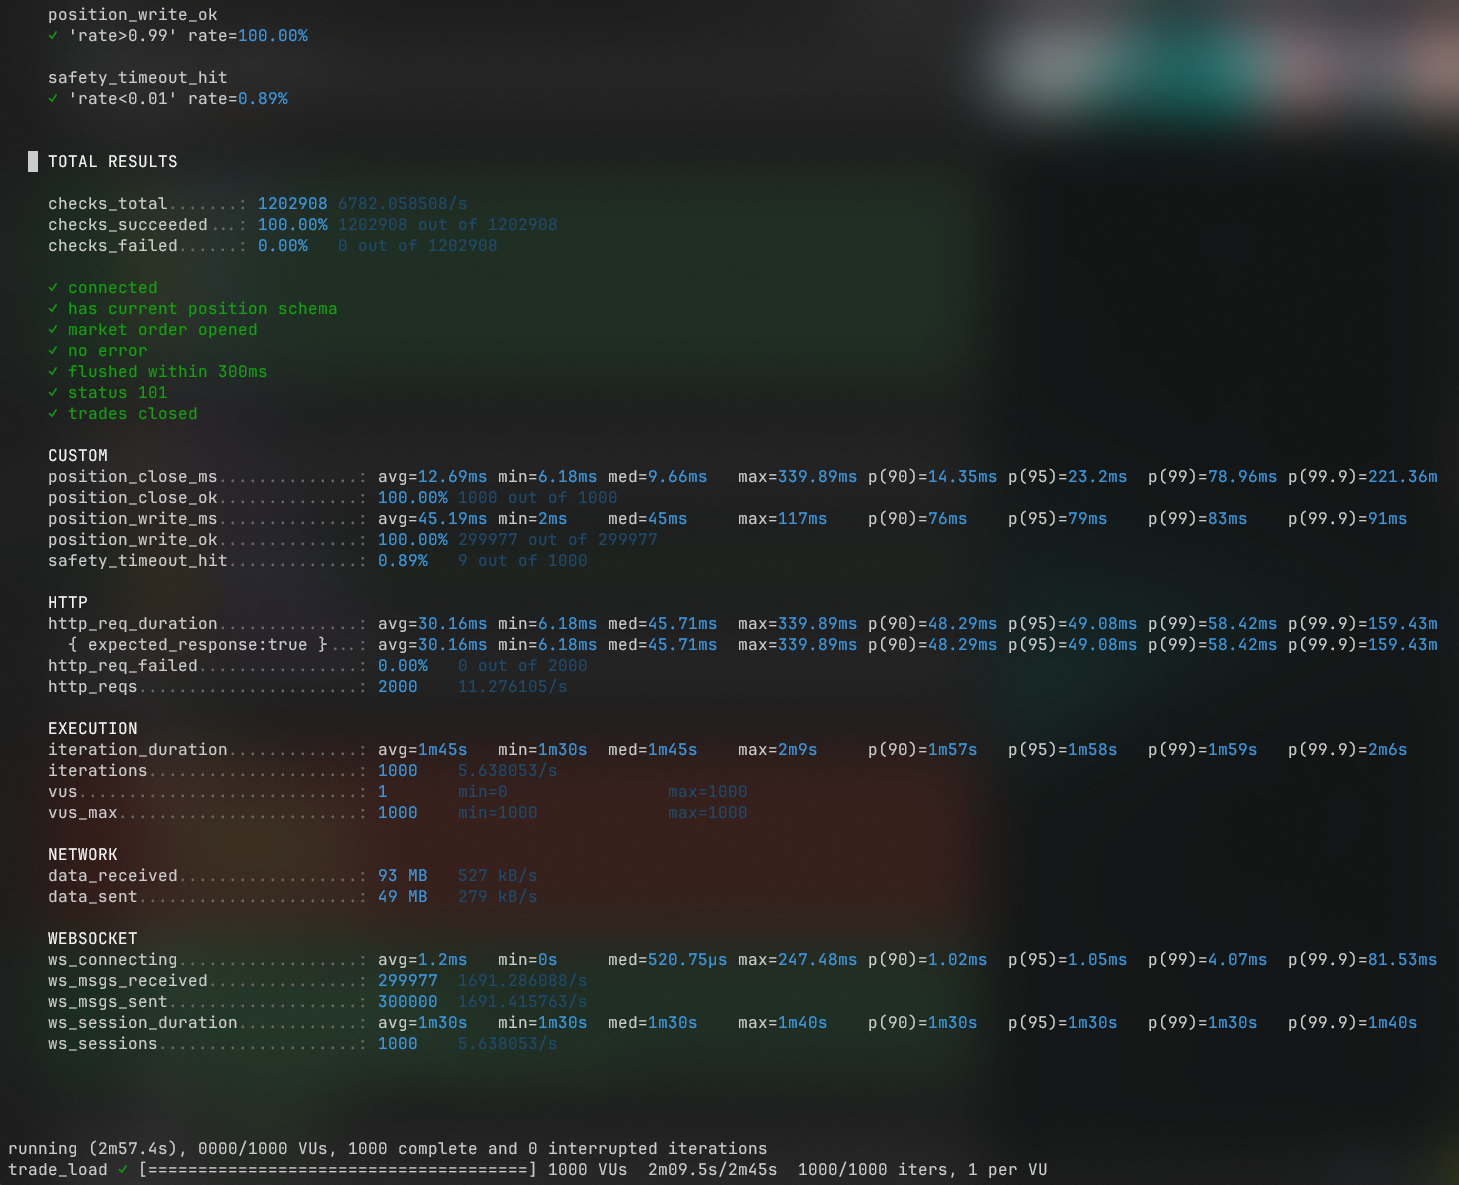
300,000 trade messages exercised · 1,000 successful batch closes · 83ms write p99 · 78.96ms close p99
 Open full size ↗
Historical retrieval
The newest chart page is kept hot in Redis and returned first. Older 500-candle pages are prepared from Parquet in the background, while closed trades use a compound cursor so retrieval stays bounded as account history grows.
- Parquet history
- 500-candle pages
- Redis page 1
- (closed_at, id) cursor
500 candles per chart page · closed-trade responses bounded to 100 records
Design Choices
Capture discretion as structured evidence
The trader's edge is represented by annotated chart relationships and multiple accepted examples, retaining nuance while making the strategy searchable and reusable.
Match structure and meaning
Price-shape similarity identifies candidates, but semantic annotation rules decide whether the interactions that matter to the strategy are actually present.
Keep the trader in the validation loop
Historical matches can be accepted, rejected or adjusted before they influence future detection, allowing the strategy library to improve without hiding its evidence.
Use one strategy path for replay and live formation
Backtesting and forward chart application share the same strategy evaluation model so the behaviour being tested is the behaviour used as new candles arrive.
Generate once, fan out many
Market data is fetched or generated once per ticker and interval, then shared across every subscribed client instead of repeating upstream work per connection.
Authenticate once, execute many
JWT verification and account lookup happen when the WebSocket is established. The resulting identity is reused so repeat authentication is removed from the per-trade path.
Serve the newest data first
The first 500 candles are returned from Redis before the full history is processed. Remaining pages are prepared in the background and requested only when needed.
Absorb bursts before PostgreSQL
Redis accepts incoming trades quickly while the flusher groups up to 1,000 rows on a 75ms cadence, reducing database round trips under concurrent load.
Keep history bounded as it grows
Closed trades use cursor pagination on closed time and trade ID with a matching partial index, avoiding increasingly expensive offset scans.
Match storage to data temperature
Redis serves hot chart state, PostgreSQL owns transactional records, and Parquet stores long-range candle history without forcing every read through one database.
Measured performance
Fivefold trade-write throughput
Across four K6 runs, Finsec scaled from 1,000 to 5,000 trade writes per second while database-write p99 moved from 77ms to 116ms.
5,000 writes/s
at 89ms database-write p99
Database-write p99
Trade writes per second
77ms
1,000/s
80ms
2,000/s
83ms
3,333/s
89ms
5,000/s
5×
Write throughput
77→89ms
Database-write p99
450,000
Messages in the largest measured run
100%
Received write confirmations successful
Expected performance
Expected performance at deployment scale
Dedicated compute extends the execution path into larger deployment-scale workloads.
10,000/s
≈99-102ms p99
Single-instance target
100,000/s
≈150ms p99
Scale-out target
Run evidence
Open any result at full size
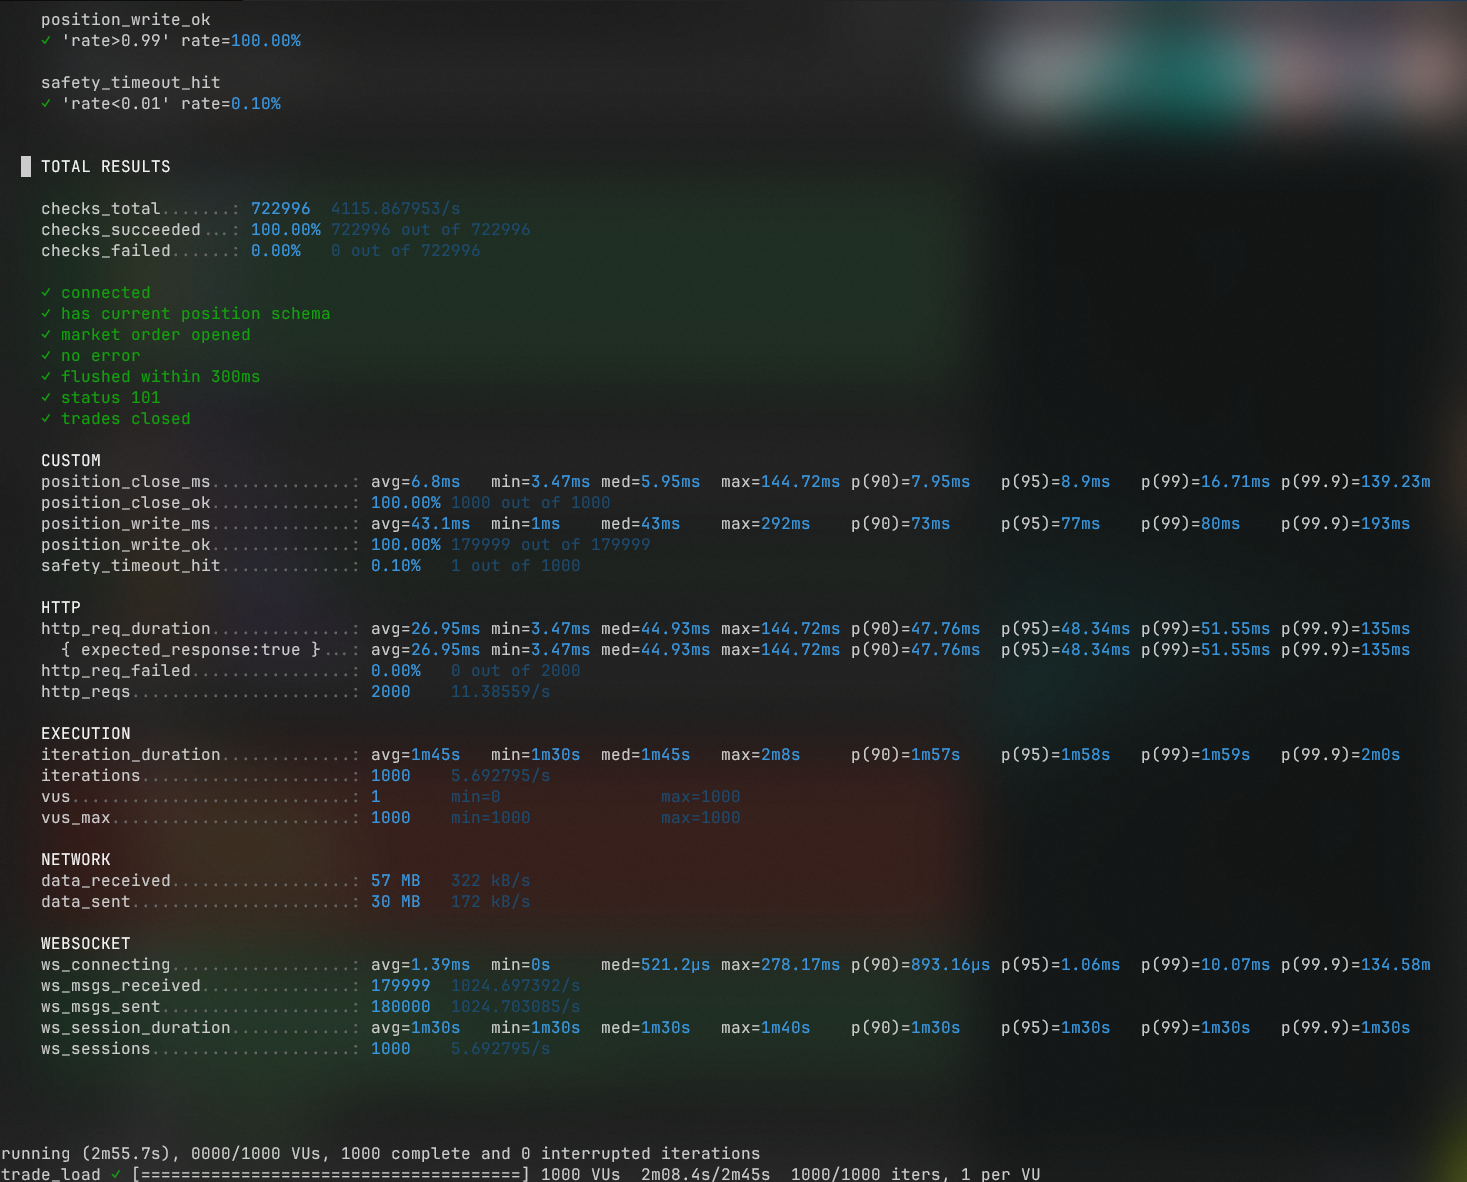
Trade path
- WebSocket order
- Redis pending queue
- Batched PostgreSQL write
- Redis confirmation
- Originating client
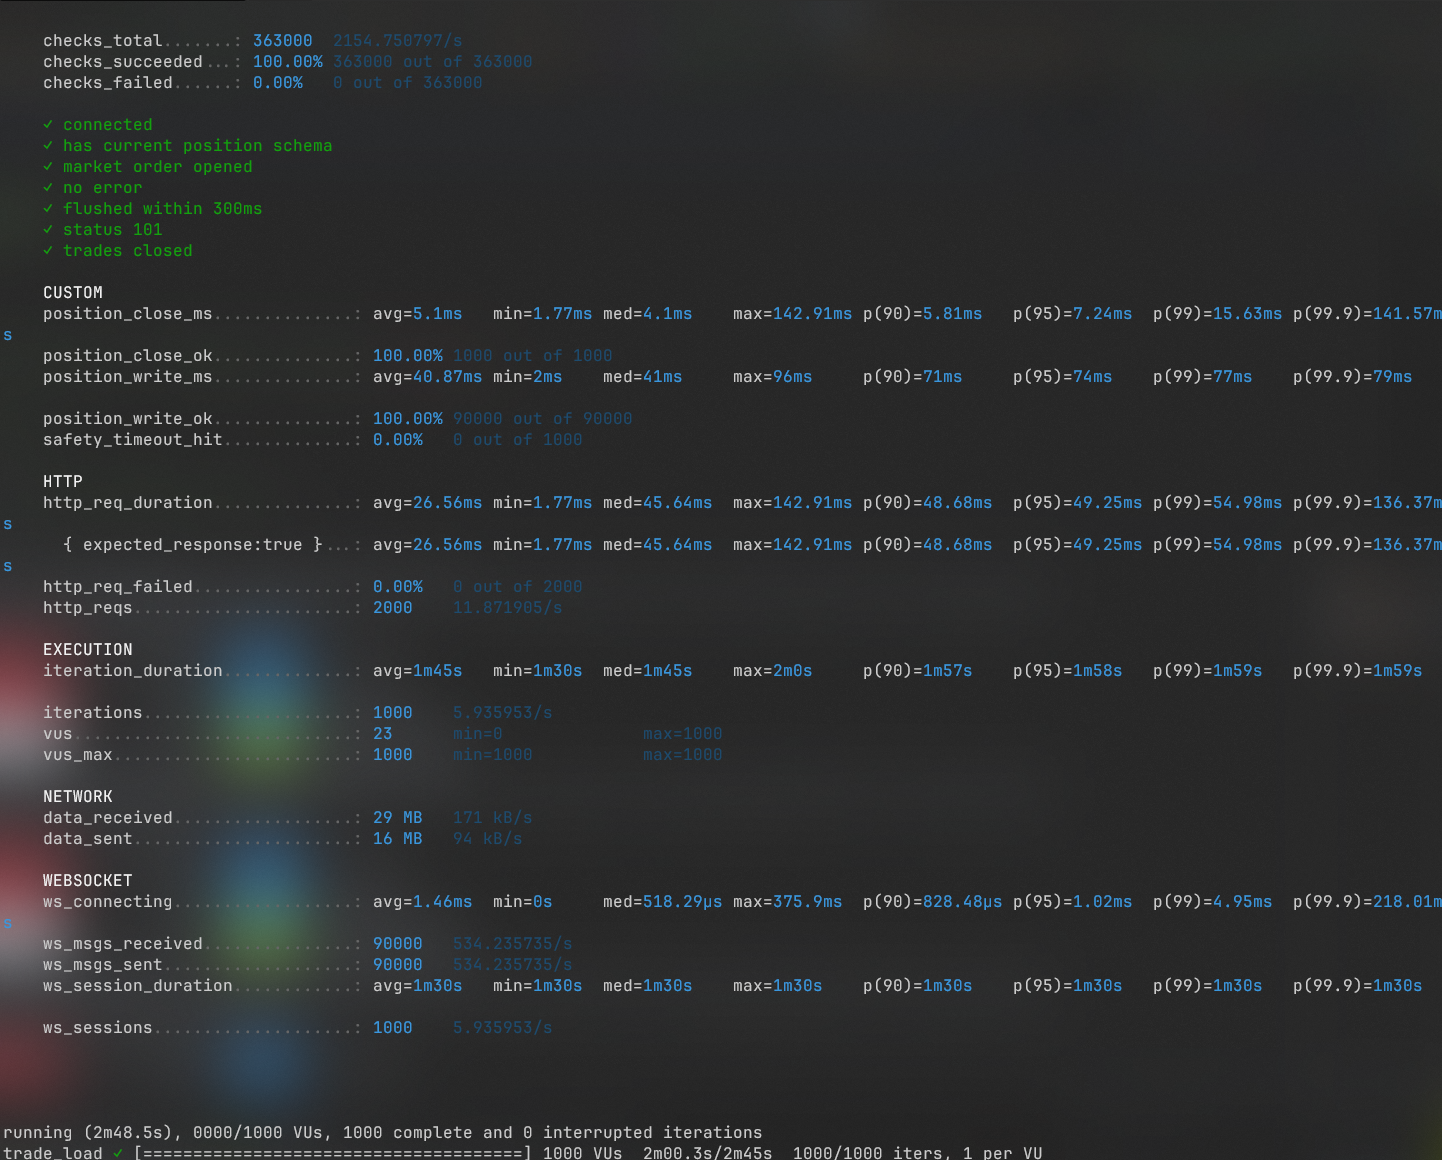
K6 result summary
EC2 load generator → EC2 application instance
Authenticated WebSocket clients: 1,000
ws_msgs_sent: 300,000
position_write_ms: p99=83ms, max=117ms
position_write_ok: 100.00%
position_close_ms: p99=78.96ms
position_close_ok: 100.00%